Growing confidence in Shanghai market
 0
0 


The thinking and behavior of investors gives shape to the bottom of the market and its recovery. Markets react more quickly to economic developments because they efficiently aggregate the changing emotions of millions of investors. Fundamental data and economic reports rely on less efficient data collection methods and the result is a delayed understanding of changing market conditions. Markets, and market behavior, are leading indicators of changes in the economy.
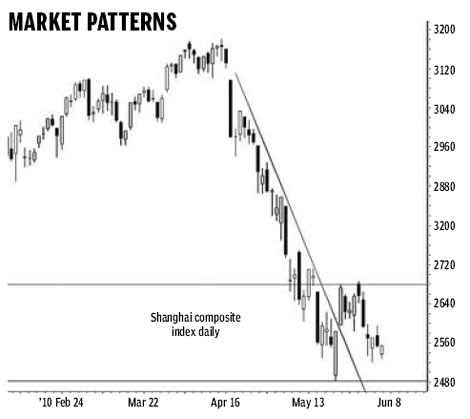
 This market leadership is shown in the developing behavior of the Shanghai Index after the rapid fall from 3,000. As the market loses value it encourages particular types of behavior from investors as they see an increase in value and opportunity as prices fall. These end-of-trend behaviors manifest themselves in price activity as a small group of repeated patterns. Behaviors repeat and so market patterns also repeat and this gives smart investors a leading signal for the best time to re-enter the market.
The Shanghai Index is developing a classic breakout consolidation pattern with four features. The first feature is the weak relative strength index (RSI) divergence pattern. This is a delayed signal because the low in the RSI occurred two weeks after the low in the index. This suggests traders need to use caution.
The second feature is the breakout from the downtrend line. This strong breakout did not develop good momentum. A small resistance level developed near 2,680 and it is a reference point for future trend development. A move above 2,680 is confirmation of strength in the new uptrend.
The third feature is the use of the downtrend line as a new support area. The fall from 3,000 used the trend line as a resistance area. After the breakout above this line and the retreat from 2,680 the trend line acts as a support level. The market slides lower until it hits a long-term horizontal historical support area.
Often the previous low of the trend provides a support area for the successful trend rebound. This is a double-bottom style trend reversal pattern. A double-bottom rebound develops when the current market retreat rebounds from near 2,481. This has a reduced probability because 2,481 is not an historical support area. The next strong historical support area for the Shanghai Index is near 2,300. This increases the probability the market will continue to slide down the downtrend line towards the 2,300 level. There is a strong probability the market will temporarily dip towards the historical support at 2,300 and then rapidly rebound. This dip could develop as a one-day fall or rebound, or a three-day pattern. The key features confirming the temporary nature of this dip are the reduction in volume as the market falls and the increase in buying volume as the index rebounds. A rapid dip below the 2,481 level does not invalidate the development of the consolidation pattern between 2,481 and 2,680.
The consolidation pattern is a very bullish development because it lays the foundation for the stronger sustainable trend rebound above 2,680. The market pattern shows investors are developing renewed buying confidence in the Shanghai market.
The author is a well-known international financial technical analysis expert.


Go to Forum >>0 Comments