Mapping a way to avoid pollution
 0 Comment(s)
 Print
Print E-mail China Daily, April 20, 2018


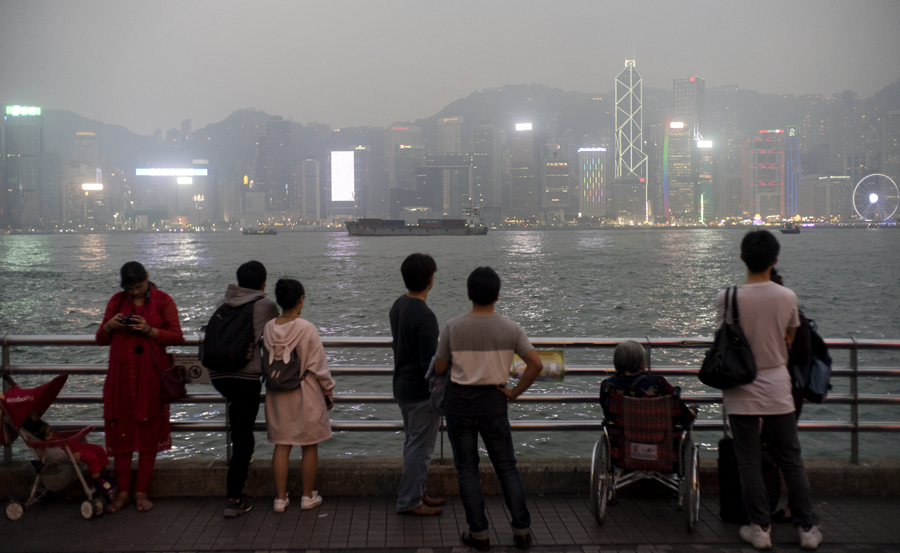
With more than 1,700 deaths blamed on air pollution in the past year, Hong Kong is badly in need of help.
It is on its way in the form of an air pollution map produced with artificial intelligence.
However, it will take about five years for the application, designed by researchers at the University of Hong Kong, to emerge from the city's miasma of nitrogen dioxide, sulfur dioxide and ozone.
The map, capable of producing real-time readings or predictive analysis, will reveal where concentrations of toxic emissions are, and where they are likely to go. The app will not solve the pollution problem but it will allow people to see what they are getting into, and let them know if it would be better to change their plans.
The readings will show the concentration of pollutants right down to the level of the street they are on.
Badly polluted air can make outdoor exercise a health hazard, because tiny particles 30 times smaller than a human hair, known as PM2.5, can find their way deep into the lungs. The app will allow someone training for a marathon, children with physical education classes scheduled and people suffering from asthma to check PM2.5 levels and stay away from high concentrations, or even postpone training or going out that day.
According to the Hedley Environmental Index designed by the School of Public Health at the university, known as HKU, air pollution was responsible for about 1,780 deaths in Hong Kong in the past year.
Like a smartwatch, the system will be able to track a person's fitness and activity level. But, more important, it will also read the air quality and even forecast it for the next hour or next day. That means it will be able to advise individuals about suitable activities based on both air quality and their personal health and fitness.
Researchers say it will provide estimates of PM2.5 concentrations for any geographical area in Hong Kong, down to the hectare level.
"It's like weather reporting, on a real-time basis, to the street level," said Victor Li On-kwok, chair professor of information engineering at the university's Department of Electrical and Electronic Engineering, who is leading the team studying the system.
Hong Kong's Environmental Protection Department operates 16 air quality monitoring stations across the city, three of which are beside roads. They provide the public with the government-designed Air Quality Health Index, which converts air pollution concentrations into a scale ranging from one, at the low end, to 10-plus.
But Li challenges the accuracy of the air quality readings provided by the monitoring stations, arguing that the number of measurements is limited and the data is too scattered geographically.
"Air quality is not like temperature, the variation of which is very small within a day," Li said. "You can have one part of the city badly polluted, but just a few blocks away the air quality may be much better."
Li and his team are designing a data-driven air pollution estimation model, based on more than 10 types of data related to urban dynamics, including air pressure, humidity, temperature, wind speed, wind direction, traffic speed and more.
With the application of artificial intelligence, the model is able to transform the measurements from the 16 government monitoring stations into 110,000 virtual stations covering the whole city and bring readings right down to street level.
Their study, published in February in the peer-reviewed journal Environmental Science and Policy, collected data for ambient pollutant concentrations from the city's Environmental Protection Department, vehicular traffic data from the Transport Department, meteorological data from the Hong Kong Observatory, and urban morphology data, including road maps, from Baidu Maps.
Li said the estimated air pollution concentrations achieved an accuracy rate of 82 percent, and that would be improved to over 90 percent when additional data is incorporated into an improved model. The team is currently gathering data on the height and density of Hong Kong's skyscrapers.
Clear relationship
The project evolved from an interdisciplinary study, involving scholars from public health management, environmental policy and environmental management. The University of Cambridge in the United Kingdom also cooperated in the study, joining with the Hong Kong research team to create the HKU-Cambridge University Clean Energy and Environment Research Platform. The Hong Kong government contributed HK$50 million ($6.37 million).
Preliminary research by the Hong Kong team has shown a clear relationship between higher air pollution and social deprivation.
The findings show low-income households are more likely to be located in areas exposed to higher PM2.5 concentrations than high-income households, with relatively impoverished parts of the city, such as Yuen Long, Sham Shui Po and Kwun Tong, generally steeped in higher levels of hazardous PM2.5 than areas on Hong Kong Island.
Social deprivation was measured through four socioeconomic criteria-income, education, occupation and homeownership-based on data from the 2011 Population Census.
Apart from the public at large, the system will also provide an individualized service for asthma patients and others at risk of being affected by bad air.
"This is very important, because for asthma patients, a small change in the peak value (of pollution) can be life-threatening," said Jacqueline Lam Chi-kei, an associate professor in HKU's Department of Electrical and Electronic Engineering and co-director of the platform.
The guideline set by the World Health Organization says the safe level of daily average PM2.5 concentration is lower than 10 micrograms per cubic meter.
During peak times, however, some readings from Hong Kong's monitoring stations can reach levels more than double that.
Meanwhile, nitrogen dioxide concentrations in the city still regularly top the WHO's 40 mcg/cu m guideline despite improving in recent years from an annual average that was triple the guideline.
Bad air not only leads to asthma but also to other diseases such as cancer, stroke and heart disease. For example, a study by a scientific officer at HKU's School of Public Health, Thuan Quoc Thach, shows that if a person is continuously exposed to PM2.5 for years, the risk of dying from any cancer is increased by 22 percent for each increase of 10 mcg/cu m in PM2.5 concentration.
Lam said one of the challenges in designing the model was to collect enough data about people's health.
"We need to collect data from them (asthma patients) on a daily basis, in terms of measurement of their health outcomes," she said. "That means we need to provide enough incentives to ensure that they go to clinic regularly to provide accurate data."
In terms of personal privacy, Li said the team will work with Microsoft researchers. The company has agreed to donate $500,000 worth of cloud computing services to support the platform.
The team has finished a prototype of the air quality map and will release it in one or two years. Later, it will develop a mobile app for the public to download, with the health-oriented route adviser being one of its most important functions.
That will be good news for people who now find themselves having to cover their noses while waiting for a bus.


Go to Forum >>0 Comment(s)