China Core Cities & Metropolitan Area Development Index 2020 released
 0 Comment(s)
 Print
Print E-mail China.org.cn, January 28, 2022


Compiled by Cloud River Urban Research Institute, an international think tank, the China Core Cities & Metropolitan Area Development Index 2020 was recently released. In the comprehensive ranking, Beijing, Shanghai, Shenzhen, and Guangzhou have occupied the top four positions for three consecutive years. Chengdu has fared well, up three places to fifth in the ranking from the first release of the index in 2017. Tianjin has fallen to sixth place from fifth in 2019, while Hangzhou (7th), Chongqing (8th), and Nanjing (9th) have all maintained their 2019 rankings.
Xi'an ranks 11th, up two places from 2019. Conversely, Wuhan drops to 13th from 11th in 2019. Ningbo has maintained its 12th place.
Among the 36 core cities, Zhengzhou, Changsha, Jinan, Hefei, Fuzhou, Harbin, Nanchang, Nanning, Haikou, Hohhot, and Lhasa have climbed the ranking, in which Hefei has seen the largest increase from 23rd in 2019 to 19th in 2020. Qingdao, Kunming, and Changchun have maintained their 2019 positions.
Xiamen, Shenyang, Dalian, Guiyang, Shijiazhuang, Taiyuan, Urumqi, Lanzhou, Xining, and Yinchuan have moved down in the ranking. Among them, Dalian has seen a bigger drop from 18th in 2019 to 23rd in 2020. In general, core cities in the north have declined significantly in the comprehensive ranking.

The China Core Cities & Metropolitan Area Development Index is supported by a selection of 442 data sets closely related with its theme, including statistical data, satellite remote sensing data, and internet data, from the 882 data sets which support the China Integrated City Index. Therefore, the China Core Cities & Metropolitan Area Development Index is a cutting-edge multimodal index that uses the "five senses" to analyze and measure a city's development through statistical resources of different fields.
For example, through satellite remote sensing data, we can accurately know the scale, distribution, and density of population in densely inhabited districts (DIDs), and analyze their relationship with other factors like economic development, infrastructures, social development, and ecological and environmental protection, elevating the research of metropolitan areas to a higher level.
It is worth noting that CO2 emissions data is included in the index. Through years of efforts, Cloud River Urban Research Institute has finally been able to calculate CO2 emissions of each city through satellite data analysis and geographic information system (GIS) analysis, which has increased the accuracy and depth of its analysis and evaluation on the cities' performance in pursuing high-quality development.
Another key feature of the index is that it is an analysis of 36 core cities, including four municipalities, 22 provincial capitals, five capitals of autonomous regions, and five cities with independent planning status, against the evaluation of 297 cities at the prefecture level or above across the country. Notably, four non-core cities — Suzhou (10th), Dongguan (20th), Wuxi (25th), and Foshan (27th) — are among the top 30 in the 2020 comprehensive ranking.
In 2020, the 36 core cities accounted for 39.2% of China's total GDP, 50.9% of its export volume, 50.1% of the total number of authorized patents, 26.6% of the permanent resident population, 42% of the population in DIDs, 67.3% of the total number of listed companies on the main board, 94.8% of the prestigious universities under the Project 985 and Project 211, 57.5% of the five-star hotels, and 47.5% of the top hospitals, according to the index. It is notable that the core cities have lead China's social and economic development.
The index mainly measures 10 major items, namely the city status, metropolitan area power, radiation ability, wide-area hub, opening and communications, business environment, innovation and entrepreneurship, ecological resources and environment, life quality and safety, as well as culture and education. It is also supported by 30 sub-items and 116 sets of index data to comprehensively evaluate the high-quality development of core cities in a science-based, systematic, and detailed manner.
What is most noteworthy about the 2020 index is that it focuses on assessing the performance of China's core cities in COVID-19 response and economic recovery. Here is an overview from the perspectives of three major items — life quality and safety, metropolitan area power, and ecological resources and environment.

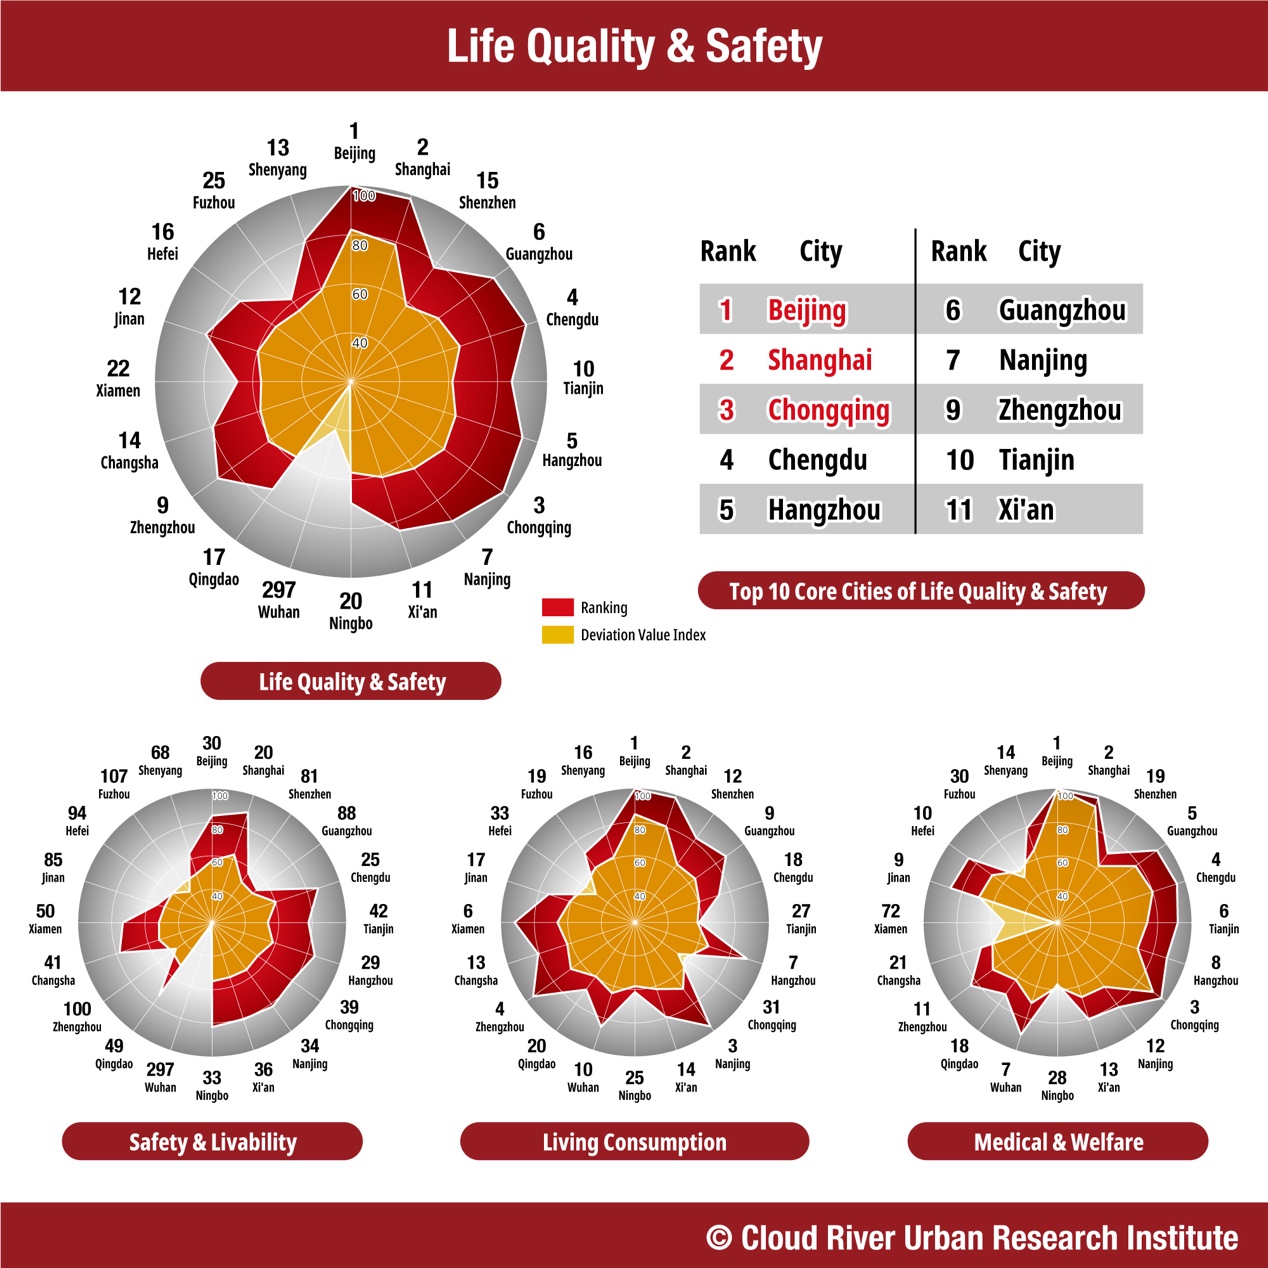
Life quality and safety: Zero-COVID-19 policy contains virus after it hit Wuhan hard
In 2020, COVID-19 put cities to test in terms of ensuring life quality and safety. Over theyear, 62.8% of the new COVID-19 cases (excluding imported cases and asymptomatic cases) were in Wuhan, but the rapid lockdown and the zero-COVID-19 policy quickly brought the virus under control. As a result, no extensive spread occurred in other cities outside Hubei province despite sporadic outbreaks, and life and production in Chinese cities quickly resumed.
The major item of life quality and safety is divided into three sub-items, namely safety and livability, living consumption, and medical welfare. The sub-items are made up of 16 data sets, including the number of people infected with the coronavirus, licensed (assistant) doctors, and top hospitals, as well as average life expectancy.
In the ranking of life quality and safety, Wuhan, hit hard by COVID-19, has fallen to the bottom of the list from eighth place in 2019. Beijing, Shanghai, and Chongqing are the top three, followed by Chengdu, Hangzhou, Guangzhou, Nanjing, Zhengzhou, and Tianjin. In the top 10 cities, Chongqing, Chengdu, and Zhengzhou have climbed higher in the ranking compared with 2019, with Chongqing entering the top three for the first time. The rankings of Beijing and Shanghai have remained unchanged, while Shenzhen and Wuhan have dropped out of the top 10.
Among the 36 core cities, Xi'an, Jinan, Shenyang, Hefei, Qingdao, Ningbo, Dalian, Harbin, Changchun, Kunming, and Hohhot have moved up in the ranking compared with 2019.
Beijing, Shanghai and Shenzhen top ranking of metropolitan area power
Metropolitan area power is one of the most basic indicators to gauge the core city. This major item focuses on not only its economy and population, but also its population concentration and structure, as well as its ability as an economic center.
In 2020, core cities across the country registered positive growth except Wuhan, which was hard hit by COVID-19, as their GDP growth rate increasing by 3 percent points on average. The strong resilience of the core cities has driven China's economy to achieve a growth rate of 2.3% despite economic contraction in other major countries.
The major indicator of metropolitan area power encompasses three sub-indicators: economic scale, metropolitan area quality, and enterprise agglomeration, including 14 sets of indicator data such as GDP scale, resident population, DID population and listed enterprises on the main board.
Beijing, Shanghai and Shenzhen have retained the top three spots in the ranking of metropolitan area power, with a remarkable deviation value. The other cities in the top 10 include Guangzhou, Chongqing, Hangzhou, Chengdu, Tianjin and Wuhan. Compared with the ranking in 2019, most of the top 10 cities remained unchanged, while Chengdu rose one place and Tianjin dropped three places.
Compared with 2019, Xi'an, Qingdao, Jinan, Kunming, Guiyang, Changchun, Taiyuan, Haikou, Xining, Yinchuan, Hohhot, Lhasa and other cities have climbed up the ranking.

Shanghai, Beijing and Tianjin: Biggest CO2 emitters
Eco-environmental quality and resource efficiency have become more and more important for the development of a city. While paying attention to environmental quality and resource efficiency, the major item of ecological resources and environment also takes into account the evaluation of environmental efforts. One highlight of this major item is the introduction of the evaluation of carbon dioxide emissions. At present, 36 core cities account for 29% of the country's carbon dioxide emissions.
In terms of carbon dioxide emissions, the top 10 core cities are Shanghai, Beijing, Tianjin, Guangzhou, Harbin, Ningbo, Qingdao, Chongqing, Jinan, and Zhengzhou.
In terms of per capita carbon dioxide emissions, the top 10 core cities are Hohhot, Taiyuan, Lanzhou, Yinchuan, Tianjin, Urumqi, Ningbo, Qingdao, Beijing, and Shanghai.
The major item of ecological resources and environment contain three sub-indicators: the quality of resource environment, environmental effort and resource efficiency, including 15 sets of indicator data, such as air quality index (AQI), CO2 emission per unit of GDP, per capita CO2 emission, and climate comfort.
Shenzhen, Shanghai and Beijing are the top three cities in the ranking of ecological resources and environment, with Shenzhen toppling Shanghai from the pole position. Other core cities in the top 10 are Guangzhou, Chongqing, Xiamen, Wuhan, and Chengdu. Compared with 2019, Shenzhen, Xiamen, Wuhan, Tianjin, Changsha, Ningbo, Hefei, Shenyang, Xi'an, Qingdao, Jinan, Lhasa, and Shijiazhuang among the 36 core cities have risen up the ranking of this major item.


Go to Forum >>0 Comment(s)