Zhou Muzhi: Identify Beijing's path to carbon peak and neutrality by benchmarking against four major metropolises
- By Zhou Muzhi
 0 Comment(s)
 Print
Print E-mail China.org.cn, July 12, 2022


Editor's note: At a time when carbon peak and neutrality has become one of the most important national strategies, all cities are looking for their own paths to it. Professor Zhou Muzhi, head of Cloud River Urban Research Institute, made a comparative study of carbon dioxide emissions of Beijing and four major metropolises worldwide — New York, London, Tokyo, and Paris — based on the latest results of satellite data parsing and geographic information system (GIS) analysis to nail down gaps in between scientifically, providing Beijing and other Chinese cities an exhaustive "physical examination report" on carbon peak and neutrality strategy.
New York, London, Tokyo, and Paris are recognized as four major metropolises worldwide. They are hubs of economic and cultural exchange in the world and benchmarks of the development of global cities. Beijing, as the capital of China, leads in China's political, cultural, scientific and technological, and economic development, and ranks first in China Integrated City Index over the years. Therefore, it is an important research approach to identifying Beijing's path to carbon peak and neutrality by comparing it with the four major metropolises in carbon dioxide emissions.
However, the four major metropolises have all spread out beyond the boundaries of cities in actual form into megalopolises. For example, Tokyo megalopolis comprises the Tokyo Metropolis and the prefectures of Kanagawa, Chiba, and Saitama. Therefore, megalopolis represents the actual state of the four major metropolises. Despite so, this form of city, which spreads out across administrative divisions, makes it harder for studying the real states of the four major metropolises.
Through years of efforts facilitated by satellite data parsing and GIS analysis, Cloud River Urban Research Institute accurately determined the scope of these megalopolises, and precisely analyzed their population size, distribution, and density. For example, by defining areas with more than 5,000 people per square kilometer as a Dense Population District (DID), it made an accurate and effective analysis of their population density and megalopolis scope.
Therefore, as shown in Figure 1, all the numerical values of the four major metropolises in this article were calculated based on megalopolis scope.
Figure 1 Scope and DID analysis of New York, London, Tokyo, and Paris megalopolises

Note: Please refer to Table 1 for detailed definitions on the megalopolis scope of the four major metropolises.
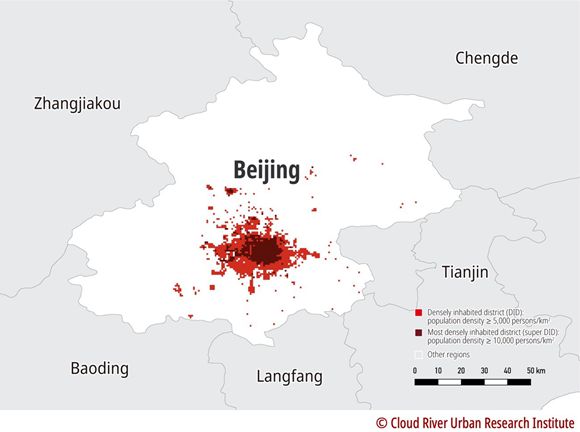
Besides, as shown in Figure 2, the megalopolis scope of Beijing determined by DID analysis is located within its administrative division, so all the numerical values of Beijing as a megalopolis are the same as those of it as a municipality.
Figure 2 DID analysis of Beijing megalopolis
Cloud River Urban Research Institute also soundly measured the development quality of the megalopolises through a multimodal index analysis based on data resources in different fields, including statistical data, big data, and satellite remote sensing data. It elevates the research on metropolises worldwide to a new level, and provides a scientific basis for the accurate comparative analysis of Beijing and the four major metropolises.
Furthermore, Cloud River Urban Research Institute managed to accurately calculate carbon dioxide emissions of cities through satellite data parsing and GIS analysis, enabling an accurate and in-depth analysis of carbon dioxide emissions of global cities.
On that basis, this article made a comparative analysis of carbon dioxide emissions of Beijing and the four major metropolises to find out gaps in between scientifically, in a bid to provide an important reference for Beijing and other Chinese cities on carbon peak and neutrality strategy.
Table 1 Area and population of Beijing, New York, London, Tokyo, and Paris megalopolises

1. Beijing's carbon dioxide emissions increase 250% in two decades
Beijing's carbon emissions grew rapidly over 20 years to a huge amount. Compared with the four major metropolises, Beijing stood out in both the growth rate and the amount of carbon emissions.
(1) Beijing's amount of carbon dioxide emissions far exceeds those of the four major metropolises
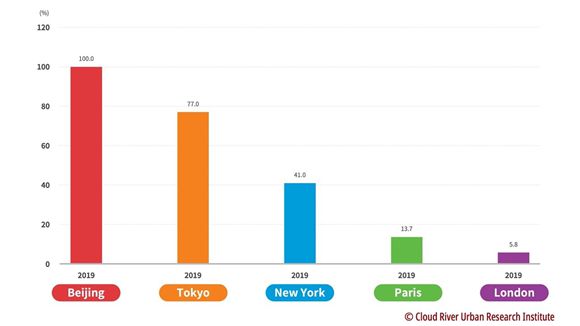
Among the five megalopolises, Beijing was the largest carbon dioxide emitter.
The emissions of Tokyo and New York megalopolises were only 77% and 41% of those of Beijing, respectively, while those of Paris and London megalopolises were even smaller — only 13.7% and 5.8% of those of Beijing, respectively. Compared with the four major metropolises, Beijing stood out in terms of emission amount.
Figure 3 Comparison between Beijing and the 4 major metropolises in terms of the amount of carbon dioxide emissions
(2019)
(2) Beijing's carbon dioxide emissions grow rapidly over two decades
Beijing's carbon dioxide emissions grew rapidly by 250% over the two decades from 2000 to 2019.
During the same time, among the four major metropolises, London, Paris, and New York megalopolises all saw their carbon dioxide emissions decrease, and merely Tokyo saw a slight increase.
Tokyo megalopolis saw its carbon dioxide emissions increase by 1.8% during that period. It was mainly because the nuclear power accident in March 11, 2011 resulted in a shutdown of all nuclear power plants (accounting for 40% of Japan's total power generation), and thus a significant increase in the proportion of thermal power generation. Even under those circumstances, Tokyo managed to limit its carbon dioxide emissions to a slight increase. That was not easy, especially when its population grew 9.9% during that period.
During the same period, the population of New York megalopolis grew by nearly 10%, and its economy doubled in size, while its carbon dioxide emissions fell by 5.8%. Paris megalopolis also brought down its carbon dioxide emissions by 18.5%, while its population and economy grew by 10.4% and 34.4%, respectively. London megalopolis saw a 24.8% increase in population and a 55.7% economic growth, but cut its carbon dioxide emissions by 44.7%.
The above analysis shows that efforts of the four major metropolises to reduce carbon dioxide emissions in the 21st century turned out to be effective.
Figure 4 Comparison between Beijing and the 4 major metropolises in terms of the amount change of carbon dioxide emissions
(2000-2019)

(3) Beijing's carbon dioxide emissions account for 2.6% of China's total
Among the five megalopolises, Tokyo megalopolis ranked first in terms of the proportion of local carbon dioxide emissions in the national total with a percentage of 17.7%, Paris megalopolis ran behind with 11.8%, and that of London megalopolis was 4%.
Japan, France, and the U.K. highly concentrated its economy in the capital economic circle, with Tokyo, Paris, and London megalopolises contributing 33.1%, 32.4%, and 23.6%, respectively, to their national economy. In comparison, carbon dioxide emission shares they contributed to the national total were much lower, an obvious advantage in energy conservation and emission reduction.
Compared with Japan, France, and the U.K., the U.S. and China have a vast territory, a large population, and relatively scattered economic hubs. As a result, New York and Beijing megalopolises contributed merely 8.8% and 3.6%, respectively, to their national economy, and took up only 2.1% and 2.6%, respectively, in national carbon dioxide emissions.
Figure 5 Comparison between Beijing and the 4 major metropolises in terms of the share of carbon dioxide emissions in the national total
(2019)

2. Huge gaps exist between Beijing and the four major metropolises in terms of carbon dioxide emissions per unit of GDP
Carbon dioxide emissions per unit of GDP, also known as "carbon intensity," measures the correlation between a country's or a city's economy and carbon emissions.
(1) London's carbon dioxide emissions per unit of GDP are less than 5% of those of Beijing
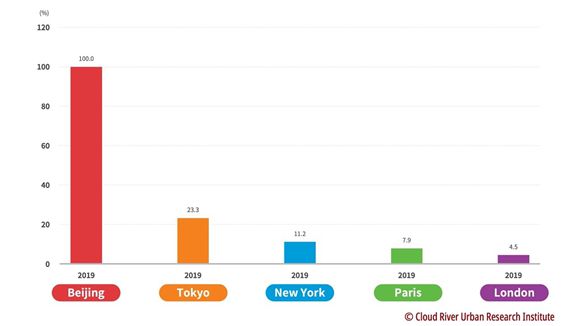
Among the five megalopolises, Beijing has the highest carbon dioxide emissions per unit of GDP.
Carbon dioxide emissions per unit of GDP of Tokyo, New York, Paris, and London are 23.3%, 11.2%, 7.9%, and 4.5% of those of Beijing, with London emitting the least carbon dioxide per unit of GDP.
Even the carbon dioxide emissions per unit of GDP of Tokyo megalopolis, the highest among the four major metropolises, are less than a quarter of those of Beijing, and those of London megalopolis are less than 5% of those of Beijing. The aforementioned data shows that there are huge gaps between Beijing and the four major metropolises in terms of economic structure and quality.
Figure 6 Comparison between Beijing and the 4 major metropolises in terms of carbon dioxide emissions per unit of GDP
(2019)
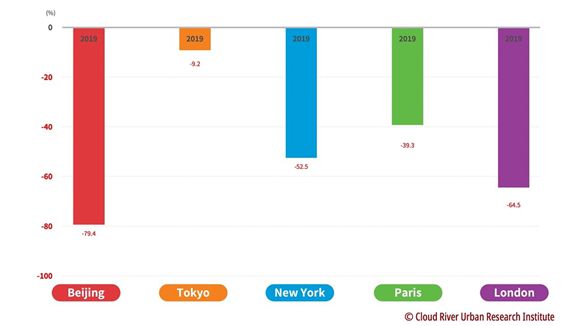
(2) Beijing's carbon dioxide emissions per unit of GDP plummet by 79.4% over two decades
Beijing saw its carbon dioxide emissions per unit of GDP plummeted by 79.4% from 2000 to 2019, the biggest drop among the five megalopolises.
The four major metropolises also made significant achievements in reducing carbon intensity during the period. New York, Paris, and London megalopolises saw their carbon dioxide emissions per unit of GDP plunge by 52.5%, 39.3%, and 64.5%, respectively. Even Tokyo megalopolis, which had to massively increase thermal power generation, saw its carbon dioxide emissions per unit of GDP fall by 9.2%.
Figure 7 Comparison between Beijing and the 4 major metropolises in terms of the change of carbon dioxide emissions per unit of GDP
(2000-2019)
(3) Beijing's carbon intensity is 73.4% of the national average level
Beijing's carbon dioxide emissions per unit of GDP are only 73.4% of the national average level, taking the lead in the country.
The four major metropolises have a much lower carbon dioxide intensity. Carbon emissions per unit of GDP in Tokyo, Paris, New York and London are only 53.5%, 36.4%, 24.1% and 16.8% of their national average levels, respectively.
This set of data reveals that these four cities have an industrial structure better than their national levels, and the agglomeration effect of megacities also shows great advantages in energy conservation and emission reduction.
Figure 8 Comparison between Beijing and the 4 major metropolises in terms of carbon intensity
(share of their national average levels in 2019)

3. Per capita carbon dioxide emissions in Beijing haven't yet reached the peak
As the economy grows, industrial activities expand, and lifestyles in food, housing and transportation develop, per capita energy consumption will increase, resulting in an increase in per capita carbon dioxide emissions. Generally speaking, when the social and economic development reaches a certain level, carbon dioxide emissions per unit of GDP will be on a downward trajectory, while per capita carbon dioxide emissions will peak later. Therefore, only a continuous decline in per capita carbon dioxide emissions can usher in a turning point. Hence, per capita carbon dioxide emissions are just a key indicator to measure carbon emissions of an economy, and per capita carbon dioxide emissions are a barometer of the real peak of carbon emissions.
(1) London's per capita carbon dioxide emissions are only 14% of Beijing's
Beijing’s per capita carbon dioxide emissions are higher than these four cities. By contrast, per capita carbon dioxide emissions of Tokyo and New York are 45.1% and 43.9% of that of Beijing, respectively. Per capita carbon dioxide emissions of Paris and London are much lower, only 24.1 and 14% of that of Beijing, respectively.
Figure 9 Comparison between Beijing and the 4 major metropolises in terms of per capita carbon emissions
(Share of Beijing's level in 2019)

(2) Beijing's per capita carbon dioxide emissions increase by 120%
From 2000 to 2019, Beijing’s per capita carbon dioxide emissions increased by 120%, the only city among the five cities that registered positive growth.
Among the four major metropolises, London reported the largest drop in per capita carbon dioxide emission, with a sharp decrease of 55.7%. Paris, New York, and Tokyo decreased by 26.1%, 14.3% and 7.4%, respectively.
Figure 10 Change of per capita carbon dioxide emissions in Beijing and the 4 major metropolises (2000-2019)

(3) Which city has lowest share of the national average level in terms of carbon dioxide emissions
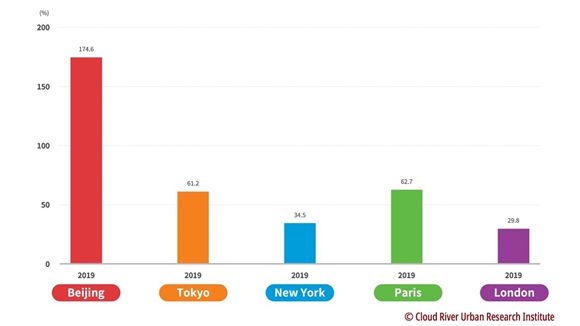
Beijing's per capita carbon dioxide emissions are 1.8 times the national level, and it is the only city in the five cities whose per capita carbon dioxide emissions outnumber its national average level.
Per capita carbon emissions of Paris and Tokyo are 62.7% and 61.2% of their national average levels, respectively. Per capita carbon dioxide emissions of New York and London are 34.5% and 29.8% of their national average levels, respectively.
Figure 11 Comparison between Beijing and the 4 major metropolises in terms of per capital carbon emissions (share of their national average levels in 2019)
The above analysis reveals that per capita carbon dioxide emissions of the four major metropolises areas are not only lower than their national average levels, but also are significantly declining. This not only reflects their advantages in social and economic development, but also underpins their endeavor to promote carbon neutrality.
Beijing, the Chinese capital, has not yet reached the turning point of per capita carbon emissions. Going forward, Beijing needs to play catch-up to enter the world's top echelon in terms of the industrial structure, urban design, and lifestyle.
(Researchers at the Cloud River Urban Research Institute Kurimoto Kenichi, Zhen Xuehua, and Zhao Jian contributed to data compilation and graphic production in the article.)


Go to Forum >>0 Comment(s)