SPECIAL REPORT

Since the founding of the PRC in 1949, China has managed to feed over one-fifth of the world’s population with less than 9% of the world’s arable land and 6.5% of the world’s surface water supply. Agricultural production experienced rapid growth after the household contract responsibility system was introduced in 1978. In recent years, especially since the 18th National Congress of the CPC in 2012, China has taken steady steps to reform the rural collective property rights system and deepen pilot reform of the rural land system, advancing supply-side structural reform in agriculture to ensure its food security.

IMPROVED OVERALL AGRICULTURAL PRODUCTION CAPACITY

Grain Production

When the PRC was founded in 1949, the grain output was only 113.2 million metric tons, which translated to 104.5 kilograms of grain per capita, providing an inadequate guarantee for people’s basic food needs. Grain production was later improved to a certain extend due to the rural land reform starting in the 1950s. In 1978, grain output reached 304.7 million metric tons. This was when the China’s reform and opening up program began, with introduction of a system of household contract responsibility, combined with the existing agricultural taxes being rescinded. These steps greatly motivated farmers, resulting in rapid growth in production. In 2012, grain output reached 612.3 million metric tons, a huge improvement in the country’s overall grain production capacity. The 18th National Congress of the CPC in that year reinforced the effort to ensure grain supply for 1.4 billion people. Grain output in 2018 reached 657.9 million metric tons, 4.8 times more than 1949, an average annual growth of 2.6%. In addition, grain per capita in 2018 reached 472 kilograms, 1.3 times more than 1949. This removes the risks threatening national food security.

Grain output in China (unit:metric tons)

700
525
350
175
0
  • 1949

  • 1953

  • 1966

  • 1978

  • 1984

  • 1993

  • 1996

  • 1998

  • 1999

  • 2007

  • 2012

  • 2013

  • 2018

Cash Crops

In 1949, cotton output was only 440,000 metric tons. After the reform and opening up, a series of policies to promote its cultivation were put forward by the government, so that, in 1984, output reached 6.26 million metric tons. Cotton output experienced further growth with the rapid development of the garment and textile industry in China after the dawning of the 21st Century. In 2007, output reached 7.6 million tons, highest in history. Since the 18th National Congress of the CPC in 2012, cotton output experienced further steady growth along with progress in agricultural supply-side structural reform. In 2018, production was 6.1 million metric tons, 12.7 times more than that in 1949, average annual growth of 3.9%.

As for oilseed, output in 2018 reached 34.33 million metric tons, 12.4 times more than 1949, average annual growth of 3.8%.

Regarding sugar crops, the 1949 figure was only 2.83 million metric tons. In 1978, this reached 23.82 million metric tons, rising in 2018 to 119.37 million metric tons, 41.1 times than 1949, with average annual growth of 5.6%.

Livestock

The overall output of pork, beef, and mutton in 1952 was only 3.39 million metric tons. In 2018, this reached 65.23 million metric tons, 18.3 times greater, with average annual growth of 4.6%. Specifically, the output of pork in 1980 was 11.34 million metric tons. In 2018 it was 54.04 million metric tons, 3.8 times greater and representing average annual growth of 4.2%. As for beef and mutton, the numbers in 2018 were 6.44 million metric tons and 4.75 million metric tons, respectively 23 times and 9.7 times more than 1980 (average annual growth of 8.7% and 6.4% respectively).

Output of poultry and eggs in 2018 reached 31.28 million metric tons, 10.1 times more than that in 1982, with average annual growth of 6.9%.

In 1980, milk output was only 1.14 million metric tons; in 2000, it had risen to 8.27 million metric tons. Due to the progress of reform and technological development, the milk industry experienced rapid growth so that, in 2006, output reached 29.45 million metric tons. Since 2008, China’s milk industry entered a period of structural readjustment with steady growth. Output in 2018 was 30.75 million metric tons, 25.9 times more than 1980, with average annual growth of 9.1%.

Fishery and Aquatic Products

The output of aquatic products in 2018 reached 64.58 million metric tons, 143 times more than that in 1949 (average annual growth of 7.5%).

Since 1989, China’s output of aquatic products has ranked first in the world.

THE UPGRADED CONDITION OF
AGRICULTURAL PRODUCTION

The PRC was founded with a poor agricultural infrastructure, which resulted in low grain output as climatic conditions imposed a heavy restriction, ranging from drought to floods. In the 1960s and 1970s, despite difficulties in many aspects, the country strengthened construction of farmland water conservancy facilities. Since the reform and opening up in 1978, a series of improvements in rural areas, notably introducing the system of household contract responsibility, has significantly improved overall agricultural productivity.

Irrigation
Agricultural infrastructure has been continuously developed to advance the construction of facilities for small scale irrigation and water conservancy. In 2018, there were 68 million ha (1.02 billion mu) of irrigated farmland in China, 2.4 times more than 1952, with average annual growth of 1.9%.
Projects to protect and improve the quality of arable land have been launched. A total of 42.67 million ha (640 million mu) of high-standard farmland have been developed, producing good yields in times of drought or excessive rain.
A total of 64.67 million ha (970 million mu) of land has been listed as functional zones for grain production and protected areas for the production of major agricultural products.
Irrigated farmland increased from 19.96 million ha in 1952 to 68.10 million ha in 2018.
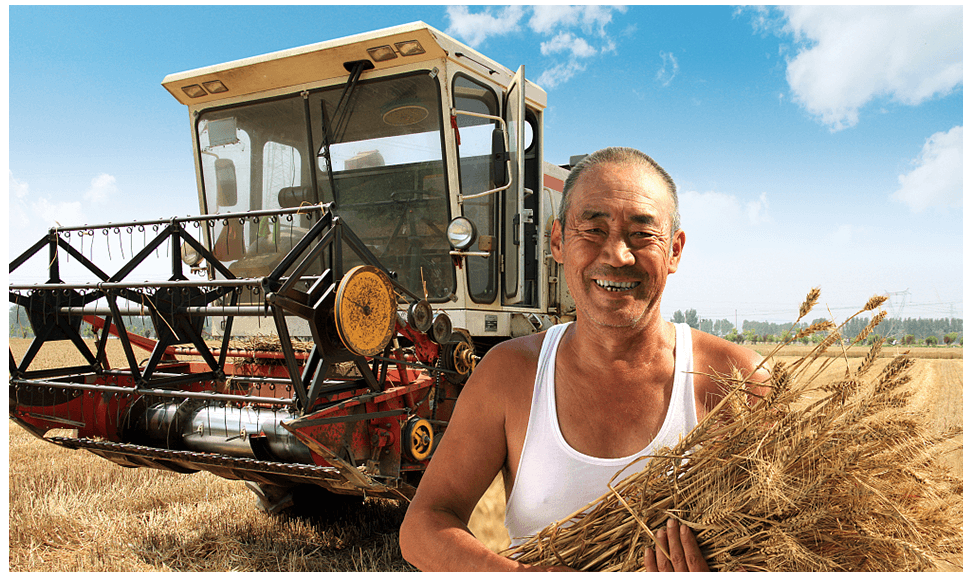
Agricultural machinery
Since the 18th National Congress of the CPC, the mechanization of ploughing, sowing, and harvesting has improved continuously, and the output of grain, meat, peanuts, tea, and fruits have led the world for years.

Total Power of Agricultural Machinery

  • 1952

    184,000 kW

  • 1978

    117.5 million kW

  • 2018

    1 billion kW

The overall level of mechanization in plowing, sowing, and harvesting of major agricultural products reached 67%, and those of major food categories reached 80%.
In 2018, the contribution of technological advances to agricultural growth hit 58.3%, or 10.3 percent higher than 2005. Technological advances contributed to a big leap in per unit yields in that period - 88 kilograms per mu to 375 kilograms per mu in 2018.
In the past 70 years, the total power of agricultural machinery underwent a remarkable leap from 180,000 kW in 1952 to one billion kW in 2018. This greatly improved the efficiency of agricultural productivity, contributing much to national food security.
CONSUMERS’ EASY ACCESS TO FOOD
The situation of food shortages in China has been significantly improved since its founding in 1949, and people’s consumption expenditure (food, tobacco and liquor) has greatly increased.
Before the reform and opening up, due to insufficient food supply and poor food variety, the household spending of Chinese people was relatively low. Since 1978, China has been transformed from a society suffering from food shortages to a well-off one.
In 2018, China’s Consumption Expenditure per Capita: Food, Tobacco and Liquor in urban areas reached 7,239 yuan, 58.3 times more than 1956; meanwhile, in rural areas this number reached was 3,646 yuan, 88.1 times more than 1953.
In addition to improved expenditure, the consumption structure has been upgraded significantly. In terms of food consumption, the consumption of basic food dropped, while that of meat, egg and milk increased remarkably.
In 2018, basic food consumption per capita in China’s urban areas was 110.0 kilograms, a 36.6% decrease over 1956; Pork consumption per capita in urban areas was 22.7 kilograms, 2.9 times more than 1956; Beef and mutton consumption per capita in urban areas was 4.2 kilograms, 1.6 times more than that in 1956; Egg consumption per capita in urban areas was 10.8 kilograms, 2.2 times more than 1956; Dairy product consumption per capita in China’s urban areas was 16.5 kilograms, 6.5 times more than 1956.
Food Consumption per capita in China’s Urban Areas
30kg
22.5kg
15kg
7.5kg
0kg

2018

1953

  • Pork
    consumption

  • Beaf and mutton
    consumption

  • Egg
    consumption

  • Egg
    consumption

The corresponding statistics in rural area in 2018 were: Basic food consumption: 148.5 kg, a 33.0% decrease than 1954; Pork consumption: 23 kg, 5.2 times more than 1954; Beef and mutton consumption: 2.2 kg, 1.4 times more than 1954; Egg consumption: 8.4 kg, 9.5 times more than 1954; Dairy product consumption: 6.9 kg, 8.9 times more than 1954.
Food Consumption per capita in China’s Rural Areas
30kg
22.5kg
15kg
7.5kg
0kg

2018

1953

  • Pork
    consumption

  • Beaf and mutton
    consumption

  • Egg
    consumption

  • Egg
    consumption

CONCLUSION
Due to the large population and heavy consumption of grains, the food security in China was, and will always have, an important bearing on world food security. The Chinese government will spare no effort to ensure grain supply for almost 1.4 billion people.