X. Progress and Achievements of China's Large Companies amid Global Financial Crisis
In September 2008, the United States' subprime mortgage crisis unexpectedly triggered the global financial crisis. At that time, China's macro economy and companies were accelerating their development with large domestic investment in fixed assets and boosted exports. Hence, the data from the Top 500 Companies of China in 2009 didn't fully reflect the impacts brought about by the global financial crisis. However, from the fourth quarter of 2008 through 2009, these impacts began to be felt by China's macro economy and large companies, in particular, export-oriented firms. In order to fight the crisis, the Chinese government launched an economic stimulus package and the industry revitalization plan, which, to a great extent, mitigated the impacts. In 2009, China's GDP saw growth of 9.1 percent and its large companies also made great achievements.
1. In spite of the financial crisis, China's large companies make progress due to the country's economic stimulus measures.
1.1 All indicators of large companies continued to rise, hitting their maximum value in the history.
In face of the global financial crisis, the State Council, or China's cabinet, launched a massive economic stimulus package and industry revitalization plan, which minimized its impacts on the Chinese economy. China's large companies, including those central state-owned companies (SOEs), local SOEs and private companies, achieved continuous growth in revenue, profits, tax payment, assets, R&D input and the number of employees. All these indicators have hit their highest levels in history. (Please refer to Table 1-23, Figure 1-2 and Figure 1-3.)
Table 1-23. Indicators of the Top 500 Companies of China in 2010 classified by ownership
(Unit: bln yuan, mln people)
|
Indicator
Ownership
|
Revenue |
Profits |
Tax Payment |
Assets |
R&D Input |
Employees |
Overseas Revenue |
|
Top 500 |
27,629.128 |
1,502.938 |
2,123.586 |
91,290.542 |
337.382 |
27.0195 |
2,504.783 |
|
State-owned |
23,399.448 |
1,258.191 |
1,957.513 |
84,113.220 |
271.887 |
23.9072 |
2,205.306 |
|
Central State-owned |
12,022.632 |
511.099 |
1,119.374 |
18,876.590 |
162.337 |
10.8328 |
1,783.512 |
|
Private |
4,229.680 |
244.747 |
166.073 |
7,177.321 |
65.495 |
3.1123 |
299.477 |
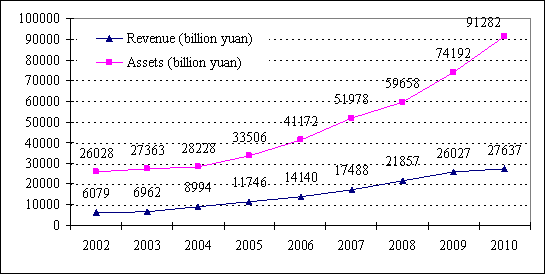
Figure 1-2. Revenue of the Top 500 Companies of China (2002-2010)

Figure 1-3. Profits and tax payment of the Top 500 Companies of China (2002-2010)
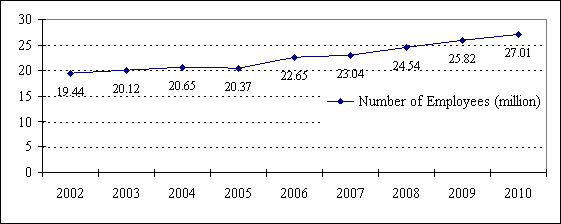
Figure 1-4. The number of employees of the Top 500 Companies of China (2002-2010)
1.2 Company assets have grown quite rapidly.
Due to the 4-trillion yuan stimulus package and the revitalization plan for 10 industries, massive investments have flowed into infrastructure development. This has directly promoted continuous asset growth among the Top 500 Companies of China, in particular, those in the fields of steel, automobiles, electrical appliances, construction materials, construction, electricity, petrochemical products, coal, non-ferrous metal and equipment manufacturing. In 2009, the total assets of the Top 500 Companies of China hit 91.3 trillion yuan, up 23.67 percent from the year 2008 (89.6 trillion yuan), amassing their largest value since 2002. The asset growth rates of state-owned companies and those central state-owned companies were 23.27 percent and 19.4 percent respectively. (Please refer to Figure 1-5.)
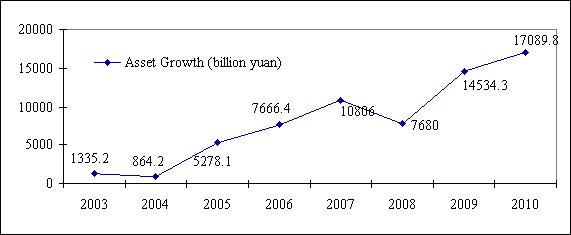
Figure 1-5. Asset growth of the Top 500 Companies of China (2003-2010)
Most of China's private companies involve light industry. In spite of the relatively small scale, these firms' assets increased to 7.18 trillion yuan, 28.67 percent more than the year 2008 (5.57 trillion yuan). Assets in these firms grew faster than the state-owned companies, central state-owned companies as well as the Top 500 Companies as a whole. (Please refer to Table 1-24.)
Table 1-24. Asset growth of the Top 500 Companies of China in 2010
(Unit: bln yuan, percent)
|
|
Assets in 2008 |
Assets in 2009 |
Asset Growth Rate |
|
Top 500 |
73,815.856 |
91,290.542 |
23.67 |
|
State-owned |
68,237.600 |
84,113.220 |
23.27 |
|
Central State-owned |
15,809.537 |
18,876.590 |
19.40 |
|
Private |
5,578.256 |
7,177.321 |
28.67 |
1.3 Economic benefits of China's large companies made a turnaround.
Economic benefits: Compared with the Top 500 Companies of China in 2009, the profits, profit growth rates and profit margins of the Top 500 in 2010 rose significantly. Seen in Figure 1-6, the economic benefits of these companies made a V-shaped turnaround from 2008 to 2010. Although the global financial crisis had a continuous impact on the Chinese economy in 2009, economic benefits of large companies still was able to rebound.
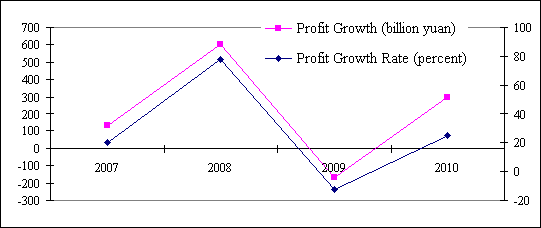
Figure 1-6. Profit growth and profit growth rate of the Top 500 Companies of China (2007-2010)
2. The global financial crisis greatly impacted China's large companies.
The global financial crisis, triggered by the United States' subprime mortgage crisis, made a severe external impact on the Chinese economy. In China's 30+ years of globalization, Chinese companies have had unprecedented association with the outside world. Despite a series of measures taken by the Chinese government, the data from the Top 500 companies indicates that the global financial crisis still greatly affected China’s large companies.
2.1 An unprecedented number of companies have seen negative revenue growth.
Among the Top 500 Companies of China in 2010, 99 earned less revenue than the previous year (Figure 1-7), specifically, 25 with a growth of -20 percent, 26 within -10~-20 percent and 48 with more than -10 percent.
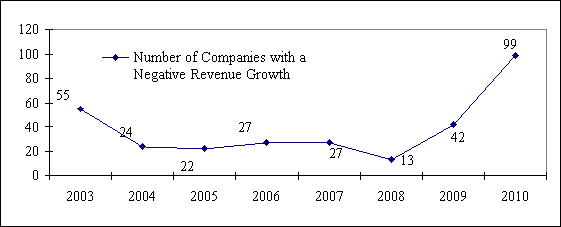
Figure 1-7. The number of companies with negative revenue growth (2003-2010)
Among the 99 companies with negative revenue growth, 22 belonged to the steel industry, accounting for 22.2 percent. 14 of the 22 companies saw a revenue growth of less than -20 percent, with Anyang Iron & Steel Group Co. Ltd (-35 percent) as the worst.
Companies on imports & exports, logistics and shipping were the hardest hit, specifically, China International Marine Containers Group Co. Ltd (-56.7 percent), Zhuhai Zhen Rong Company (-43.1 percent), China Shipping (Group) Co. (-40 percent) and SINOTRANS & CSC (China National Foreign Trade Transportation (Group) Corporation & China Changjiang National Shipping (Group) Corporation) (-21.5 percent).
Also, China's three major airline companies, two petroleum companies and seven commercial banks saw negative revenue growth to different degrees.
 0
0 


Go to Forum >>0 Comments