The shifting global balance of power
- By Danny Quah
 0 Comment(s)
 Print
Print E-mail
China.org.cn, April 18, 2011
E-mail
China.org.cn, April 18, 2011


 |
|
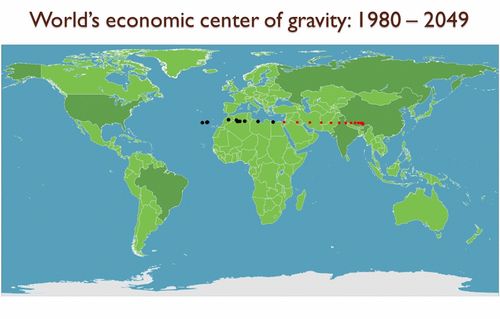
The world's shifting economic center of gravity. Black dots represent movement from its 1980 mid-Atlantic position to the present. Red dots are forward projections to 2049. |
Sometime in 2010 China became the world's second-largest economy, along the way overtaking Japan, Germany, the UK, France, and all the rest of Western Europe. Today, the economic strength of China is exceeded only by that of the US. By some accounts China today already consumes half the world's output of refined aluminum, coal, and zinc; and uses twice as much crude steel as the EU, the US, and Japan combined. India, the only other billion-people nation on the planet, has launched itself on a similar growth path, after a half-century of moribund quiescence. These two giant economies are now growing at a pace previously recorded only in easier-to-ignore, special-case, tiny Far East Asian island nations. The emergence of the East has, in the last three decades, yanked the world's economic center of gravity nearly 5000 km from its 1980 mid-Atlantic location, eastwards past Helsinki and Bucharest, onto a trajectory aimed squarely at India and China.
What do I mean by the world's economic center of gravity?
Because the Earth is curved, a straight line connecting New York City and London plunges deep beneath the Atlantic Ocean. The half-way point on this line is desolate and miserable: it is cold, wet, and hundreds of miles beneath the waves of the Atlantic. If you were to rise straight up to the surface from that depth, there would be absolutely nothing around but thousands of miles of water in every direction.
Since New York generates higher income than London, the midway point doesn't accurately represent the economic activity of the two cities combined: The economic center of gravity shades towards New York, moving west proportionally to the extent New York's income exceeds London's.
If you add in a third point, to account, say, for the income being generated in Shanghai, the triangle of cities – New York, London, Shanghai – would have an economic center of gravity somewhere between the three, pulled with varying strength between each of the triangle's vertices depending on the incomes in each of them.
If you then add into the mix all 700 locations on the planet individually identifiable as urban agglomerations and rural centres, you would have the world economic center of gravity.
Since incomes and populations change over time, so too the world economic center of gravity shifts about on Earth. To visualize this on a map, it is convenient to "float" the center of gravity towards the planet's surface: This produces the map above.


Go to Forum >>0 Comment(s)