The B&R's regional growth potential is world's greatest
- By John Ross
 0 Comment(s)
 Print
Print E-mail China.org.cn, May 13, 2017


It is widely understood regarding the Beijing Belt and Road (B&R) summit on May 14-15 that the Belt and Road Initiative (BRI) is a decisive strategic project for China and participating countries. But it is still not widely grasped just how much greater the economic growth potential is in the B&R region compared to other world economic centers.
As will be shown, the B&R area has by far the greatest growth potential, both in percentage and absolute terms, of any major economic region – including North America and Europe.
Grasping the scale of the difference of the growth potential of the B&R region is crucial for understanding the full strategic significance of this initiative. This article therefore puts more precise numbers on the economic growth potential of the B&R region compared to the other major economic centers.
To demonstrate the full scale of the BRI's potential, this article uses the IMF's latest economic growth projections. It should be made clear that using these figures does not at all mean that they are being taken as a 100 percent accurate prediction of what will occur.
But the IMF projections clearly establish that growth in the B&R region will be very much higher than in North America or Europe. Entirely implausible assumptions of future development would therefore have to be made for the far stronger growth of B&R not to be strikingly apparent.
To avoid the suggestion of inflating numbers for the purposes of this article, the B&R region will be defined as China, member states of ASEAN, states of the former USSR except the Baltic States, all states in the Himalayas and Indian subcontinent, and in the Middle East; Iran, Iraq, and Turkey. Other states display strong interest in the BRI, including for example in Eastern Europe and the Middle East, but to avoid any suggestion of exaggerating figures these have not been included.
As B&R is a regional initiative in this article, data for North America, including Canada and Mexico, is given – rather than simply that for the U.S. For Europe, the European Union (EU) as a whole is taken. Given this framework then:
-
Measured at current exchange rates, projections from IMF data from 2016-2021 show the B&R region will account for 46 percent of world economic growth – compared to 24 percent for North America and 10 percent for the European Union.
-
If purchasing power parities (PPPs) were used, the differences in growth would be even greater. The B&R region would account for 58 percent of world growth – compared to 13 percent for North America and 11 percent for the EU. However, to avoid discussion of PPP measures, only economic projections at current exchange rates are used below.
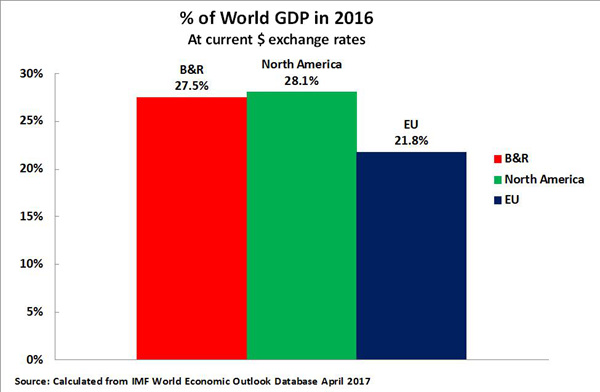
The situation in 2016
As a starting point, Figure 1 shows that in 2016 the GDPs of the B&R region and the North American region were approximately equal in size while the EU was slightly smaller than either – B&R being equivalent to 27.5 percent of World GDP, North America 28.1 percent, and the EU 21.8 percent.


Go to Forum >>0 Comment(s)