|
|
Economy |
|
||||||||||
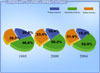
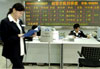
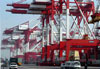
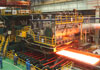
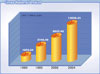
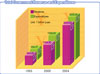
In 2004, the GDP of China was 13.65 trillion yuan, up 9.5 percent over the previous year at comparable prices. The added value of the primary industry was 2.07 trillion yuan, up 6.3 percent; that of the secondary industry was 7.24 trillion yuan, up 11.1 percent; and that of the tertiary industry was 4.34 trillion The general level of consumer prices of the year was up 3.9 percent over the previous year. Of this total, the prices for service items were up 2.3 percent. The retail prices of commodities were up 2.8 percent, while the producers' prices for manufactured goods increased 6.1 percent, and the purchasing prices for raw materials, fuels and power went up 11.4 percent. The prices for investment in fixed assets were up 5.6 percent. Producers' prices of farm products were up 13.1 percent. In 2004, China had a trade surplus of US$32 billion, an increase of US$6.5 billion as compared with that in the previous year. The volume of foreign capital utilized continued to increase. At the end of the year, China's foreign exchange reserves reached US$609.9 billion, an increase of US$206.7 billion as compared with that at the end of the pervious year. The exchange rate of RMB remained stable; the year-end exchange rate was 8.2765 yuan to US$1, which was 2 basic points higher than that at the end of the previous year. Tax revenue of various forms for the whole year reached 2.57 trillion
yuan (excluding tariffs and agricultural taxes), up 25.7 percent, or an
increase of 525.6 billion yuan, over the previous year. The profits made
by industrial enterprises above designated size (i.e. all state-owned
enterprises and those non-state-owned enterprises with an annual sales
revenue over 5 million yuan) stood at 1.13 trillion yuan, an increase
of 38.1 percent over the previous year. |
| Composition of Gross Domestic Product | |
| Total Government Revenue and Expenditures and Their Increase Rate | |
| Budgetary Expenditures by Accounting Item | |
| Per-capita Output of Major Industrial and Agricultural Products | |
| Household Consumption | |
| Price Indices | |
| Total Wages of Staff and Workers and Related Index | |
| Principal Aggregate Indicators on National Economic and Social Development and Their Related Indices | |
| Balance of Foreign Debts | |
| Risk Indicators on Foreign Debts | |
| Top 500 Chinese Enterprises |